Over the past week, the price of Bitcoin (BTC) has fallen by about 5%, with the decline in the Nasdaq index dragging down risk assets. Any bullish predictions for Bitcoin prices now depend on whether the cooling demand in the United States can recover.

Bitcoin's price has fallen, confirming a bearish pattern. However, the unbalanced movements in the derivatives market and weak selling volume suggest that this downtrend may not be sustainable. The real trigger lies in Washington, not just the cryptocurrency sector.
Join the official OpenScore community :
Telegram: @openscoreappWhatsApp: wa.me/971586321066
Line: line.me/ti/p/_GPRgudDF4
Bitcoin's price movement today mirrored that of the Nasdaq index, as interest rate hike expectations impacted both.
The Nasdaq Composite Index fell sharply today. On June 23, the Nasdaq Composite closed at 25,587 points, down about 2% on the day and a cumulative decline of about 4% over five trading days. Alphabet's stock price fell 6%, and chip stocks such as Micron saw declines of over 10%.
Two main factors led to the recent stock market crash. Investors questioned the massive investments in artificial intelligence and increased their bets on rising interest rates. The Federal Reserve kept interest rates in the 3.50% to 3.75% range on June 17, but its latest projections indicate at least one rate hike in 2026.
This shift to a hawkish stance pushed up the yield on the 10-year U.S. Treasury note (the benchmark rate for most risky assets) to around 4.5%. Rising yields tend to draw funds away from risky assets.
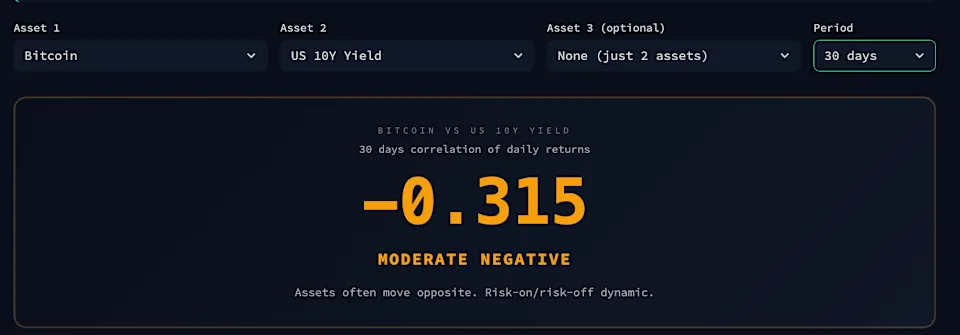
Changes in yields directly impact Bitcoin. Bitcoin's correlation with the 30-day yield of 10-year Treasury bonds is approximately -0.315, a moderate negative correlation, meaning they tend to move in opposite directions. Rising yields naturally put pressure on Bitcoin.
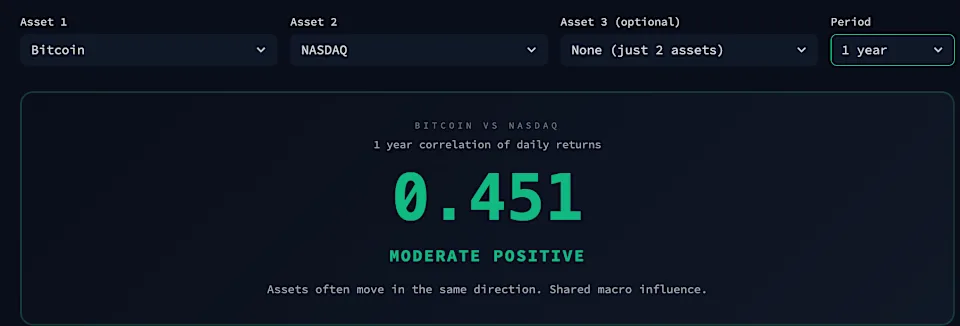
Bitcoin's price movements are also closely correlated with those of tech stocks. The 30-day positive correlation between BTC and the Nasdaq index is close to 0.451, meaning they tend to move in tandem. Therefore, when high yields drag down tech stocks, Bitcoin also tends to decline.
This correlation explains Bitcoin's relative weakness. Bitcoin fell by about 5%, while the Nasdaq fell by about 4%, so Bitcoin lagged behind the sell-off rather than leading the rebound.
Therefore, the same risk aversion led investors to sell off tech stocks, which in turn affected Bitcoin. This general weakness is now reflected on the charts.
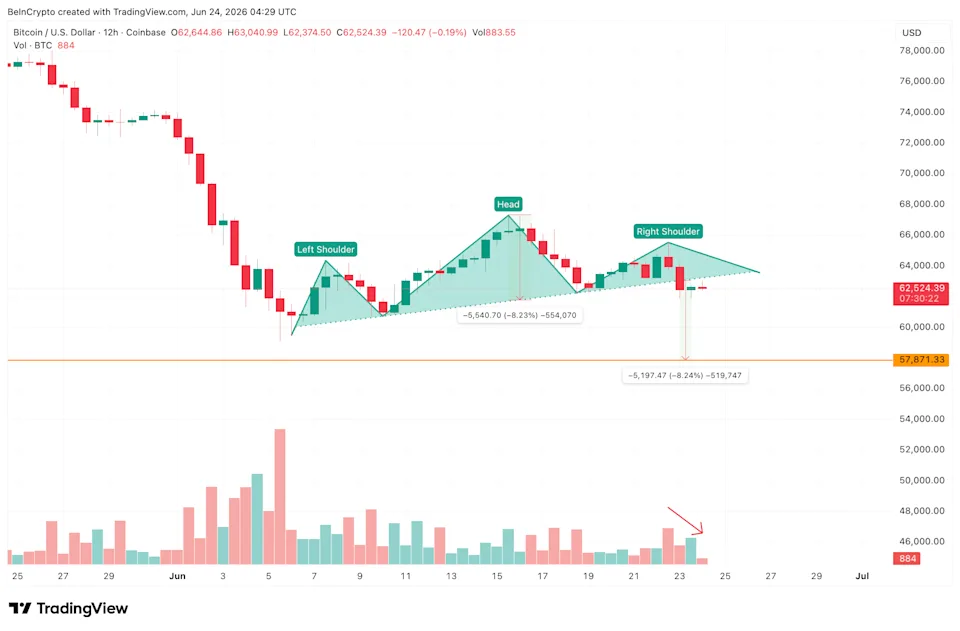
On the 12-hour chart, Bitcoin broke below a head and shoulders pattern, a pattern characterized by a higher peak situated between two lower peaks. This decline was accompanied by weakening selling pressure, which suggests that market expectations for a price rebound remain.
However, whether US buyers are truly withdrawing from the Bitcoin market, and not just the technology products market, requires direct demand metrics to measure.
Demand in the US cooled as the Coinbase Premium index declined.
The Coinbase Premium Index, which measures the difference between fees paid by US investors on Coinbase and those on foreign exchanges, fell to approximately -0.14 on June 23. This is a decrease from -0.04 on June 13, indicating a sharp widening of the discount in less than two weeks.
How do you determine the market direction next? Open OpenScore , first look at the on-chain data, then look at market sentiment, and finally combine this with trending events to form your own judgment.
This article is for market information compilation and product display purposes only and does not constitute any investment, trading, or financial advice. Digital asset prices are highly volatile; please make decisions prudently based on your own risk tolerance.